LEOMO App Screens
LEOMO App Home Screen
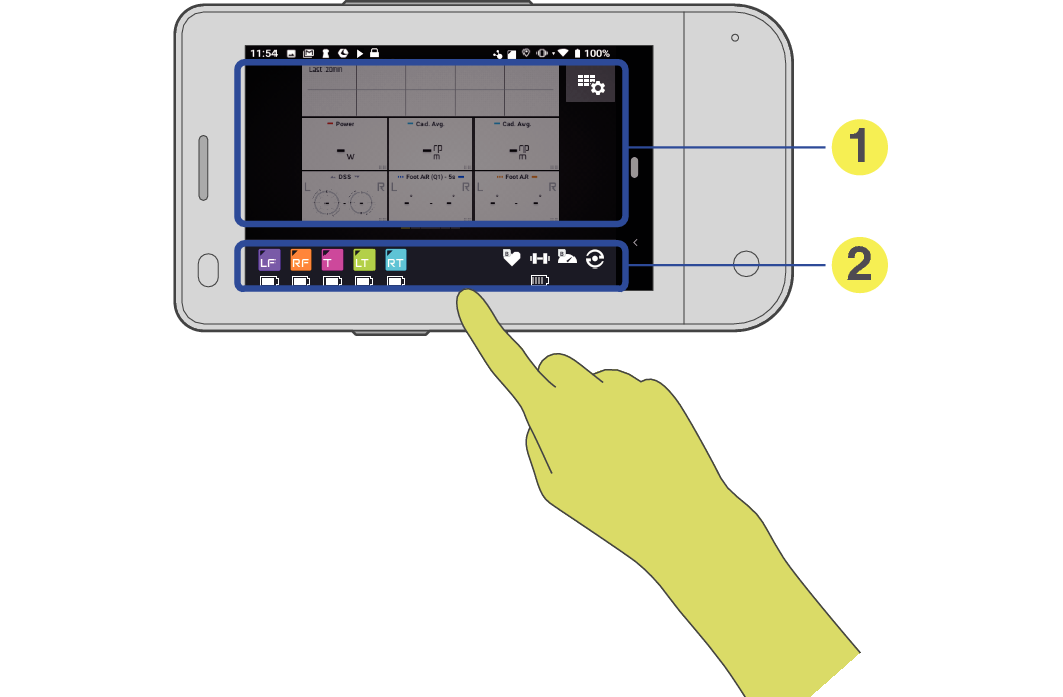
Swipe up from the bottom of the screen to access Quick Menu
-
Data pages
-
Paired sensors connection status
Data pages can be customized though the LEOMO App.
Swipe left / right to change pages.
Paired LEOMO Motion Sensors and ANT+ sensors (power meters, heart rate sensors, speed sensors, and cadence sensors) will show here.
Disconnected sensors will show as a dark grey icon.
Connected ANT+ sensors will be white. Connected LEOMO Motion Sensors will show assigned color and location:
LF = Left foot
RF = Right foot
LT = Left thigh
RT = Right thigh
S = Sacrum
T = Torso
Empty = Connected but not assigned (will not record data)
Quick Menu Screen
(Swipe up from the bottom of the screen to access Quick Menu)

-
ANT+ sensors
-
LEOMO Motion Sensors
-
Display brightness
-
ACTIVITY LOG
-
Close Quick Menu
-
MENU
Activity Screens
Data Pages
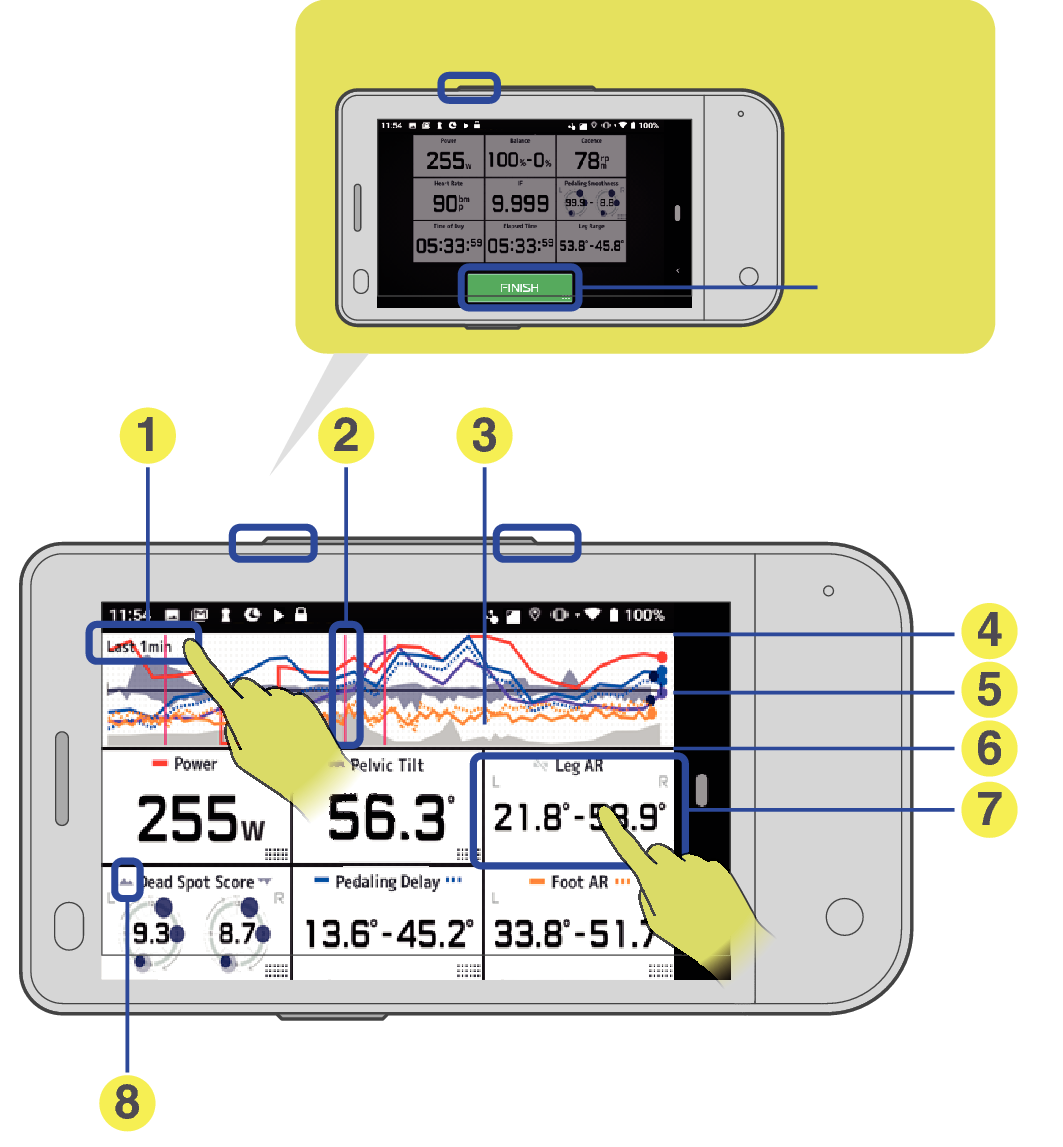
Resume
Finish activity
Pause
Lap
-
Graph range
-
Lap line
-
Elevation
-
Max point (scaled)
-
0 for “balanced” values
-
0 / min point (scaled)
-
Data box
-
Graph icon
Tap graph anywhere to change range.
Short press - turn graph on/off
Long press - open Detailed Data page
Graph type (standard or balanced), graph color, graph on/off status.
Data Detail Page (MPIs only)

Pause
Lap
-
Current value
-
5 min average
-
Close